


This post shows you how to visualize association rules by using the R packages arules and aulesViz. In order to test the script, you must have already completed the following parts.
- Part 1 Transactions Class in arules
- Part 2 Read Transaction Data
- Part 3 Generate Itemsets
- Part 4 Generate Rules
The Basket Data
In Part 2 Read Transaction Data,
we have read the following five shopping baskets into transactions of the Transactions class.
 f,a,c,d,g,l,m,p
 a,b,c,f,l,m,o
 b,f,h,j,o
 b,c,k,s,p
 a,f,c,e,l,p,m,n
In Part 3 Generate Itemsets, we run arules::apriori with the parameter target set to frequent itemsets. By assigning values to the parameters support, and set minlen and maxlen equal to each other, the apriori function returns all itemsets of a specific length having the minimum support or above.
In Part 4 Generate Rules, we run arules::apriori with the parameter target set to rules. By assigning values to the parameters support and confident, and set minlen to prune the rules of 1 item, the apriori function returns all the rules having at least 2 items which exceeds the confident threshold.
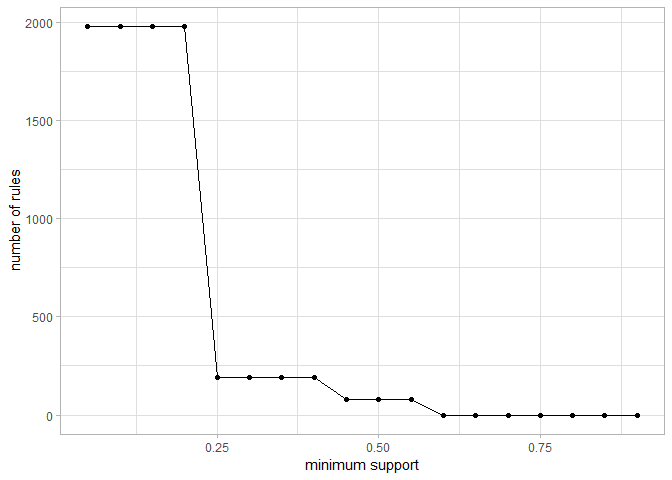
In this part, we visualize how fast an increasing minimum support will prune rules.
Visualization 1: Minimum Rule Support vs. Number of Rules
1. Iteration
The first script creates a sequence minSupport for the min support range from 0.05 to 0.9 with a step 0.05. The for loop iterates on every minimum support and find the total rules for each support value. Store all of the totals in a vector totalRules.
minSupport <- seq(0.05, 0.9, 0.05)
totalRules <- c()
for(support in minSupport){
  rules <- apriori(transactions,
                   parameter=list(support=support,confidence=0.6,minlen=2,target="rules"))
  totalRules <- c(totalRules,length(rules))
}
## Warning in apriori(transactions, parameter = list(support = support,
## confidence = 0.6, : Mining stopped (maxlen reached). Only patterns up to a
## length of 6 returned!

## Warning in apriori(transactions, parameter = list(support = support,
## confidence = 0.6, : Mining stopped (maxlen reached). Only patterns up to a
## length of 6 returned!

## Warning in apriori(transactions, parameter = list(support = support,
## confidence = 0.6, : Mining stopped (maxlen reached). Only patterns up to a
## length of 6 returned!

## Warning in apriori(transactions, parameter = list(support = support,
## confidence = 0.6, : Mining stopped (maxlen reached). Only patterns up to a
## length of 6 returned!
## Warning in apriori(transactions, parameter = list(support = support,
## confidence = 0.6, : Mining stopped (maxlen reached). Only patterns up to a
## length of 5 returned!

## Warning in apriori(transactions, parameter = list(support = support,
## confidence = 0.6, : Mining stopped (maxlen reached). Only patterns up to a
## length of 5 returned!

## Warning in apriori(transactions, parameter = list(support = support,
## confidence = 0.6, : Mining stopped (maxlen reached). Only patterns up to a
## length of 5 returned!
2. Combination
The second script writes two vectors, minSupport and totalRules, into a tibble rule2support. Print the tibble to show 18 pairs of minSupport and totalRules.
rule2support <- tibble(minSupport,totalRules)
rule2support
## # A tibble: 18 x 2
##    minSupport totalRules
##         <dbl>      <int>
##  1       0.05       1978
##  2       0.1        1978
##  3       0.15       1978
##  4       0.2        1978
##  5       0.25        193
##  6       0.3         193
##  7       0.35        193
##  8       0.4         193
##  9       0.45         77
## 10       0.5          77
## 11       0.55         77
## 12       0.6           0
## 13       0.65          0
## 14       0.7           0
## 15       0.75          0
## 16       0.8           0
## 17       0.85          0
## 18       0.9           0
Note that after minSupport goes up to 0.6, no rule meets the threshold any more. It implies that with the minimum confident 0.6, the higheset minimum support should be above 0.6 to avoid all rules are eliminated.
3. Plot
rule2support %>%
  ggplot(aes(x=minSupport,y=totalRules)) + geom_line() + geom_point() + labs(x="minimum support",y="number of rules") + theme_light()
Exercise
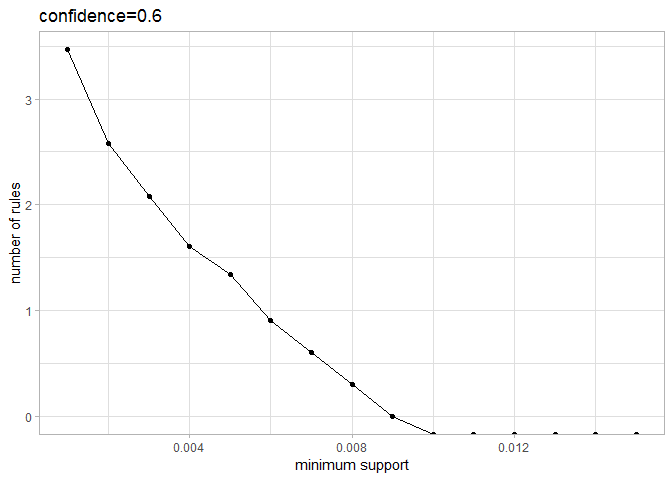
Write a script which mines association rules from a build-in data, Groceries in the arules package. Set the minimum confidence to 0.6. Visiualize how the minimum support affects number of rules. Find the lowest support which will keep at least one rule.
rule2support %>% slice(1:15)
## # A tibble: 15 x 2
##    minSupport totalRules
##         <dbl>      <int>
##  1      0.001       2918
##  2      0.002        376
##  3      0.003        120
##  4      0.004         40
##  5      0.005         22
##  6      0.006          8
##  7      0.007          4
##  8      0.008          2
##  9      0.009          1
## 10      0.01           0
## 11      0.011          0
## 12      0.012          0
## 13      0.013          0
## 14      0.014          0
## 15      0.015          0
rule2support %>% slice(1:15) %>%
  ggplot(aes(x=minSupport,y=log10(totalRules))) +
  geom_line() +
  geom_point() +
  labs(title="confidence=0.6", x="minimum support",y="number of rules") + theme_light()
Share this post
Twitter
Facebook
LinkedIn
Email