


Linear regression is a simple while practical model for making predictions in many fields. In order to apply linear regression to a dataset and evaluate how well the model will perform, we can build a predictive learning process in RapidMiner Studio to predict a quantitative value.
Prerequisite
If you have not yet read the following three links, you may want to read them before starting this tutorial.
-
If you want to know what a simple linear regression model is, read Linear Regression Analysis.
Linear regression model explains the relationship between a quantitative label to be predicted and one or more predictors (regular attributes) by fitting a linear equation to observed objects (with labels). The developed linear model will predict the label for unlabeled objects.
-
The typical operations in a predictive learning process are briefly covered in Predictive Learning from an Operational Perspective.
Collecting data, inspecting data, cleaning data, partitioning data, building model, evaluating model, optimizing model, deploying model and integrating model to other systems.
-
Building a RapidMiner Process with Linear Regression Model: A sample RapidMiner Studio process that trains a linear regression model for sample data points that are artificially generated from a binary linear relationship.
The Dataset
The data is Wine Data Set from UCI Machine Learning Repository. The Wine dataset is currently the third most popular dataset since 2007 at the UCI repository site. The Wine dataset is for classification or regression.
The following screen capture is the data download page of the wine data.
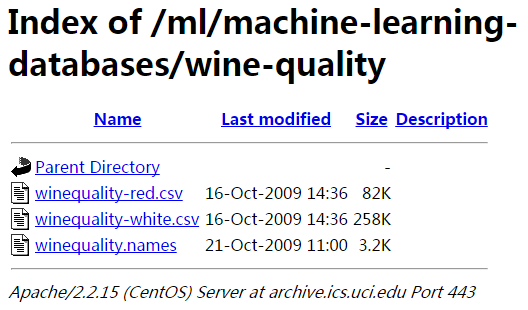
Read the file winequality.names to find a description of the dataset including attributes information and the purpose of this dataset.
There are two datasets inside; winequality-red.csv is the red wine data and the other one winequality-white.csv is for the white wine.
In this tutorial, we will train the model on the red wine data in winequality-red.csv.
You can either download the dataset winequality-red.csv from the UCI or load the data in a RapidMiner process via the operator Read URL, using the following URL.
https://archive.ics.uci.edu/ml/machine-learning-databases/wine-quality/winequality-red.csvNote:
- The dataset is semicolon (;) delimited in column values.
- The first row is the attribute names.
- In this tutorial, the column
qualityis the label of integer type that is selected as the expected output from the model. - The model will be trained upon 70% samples and tested with the rest data.
Building a RapidMiner Process
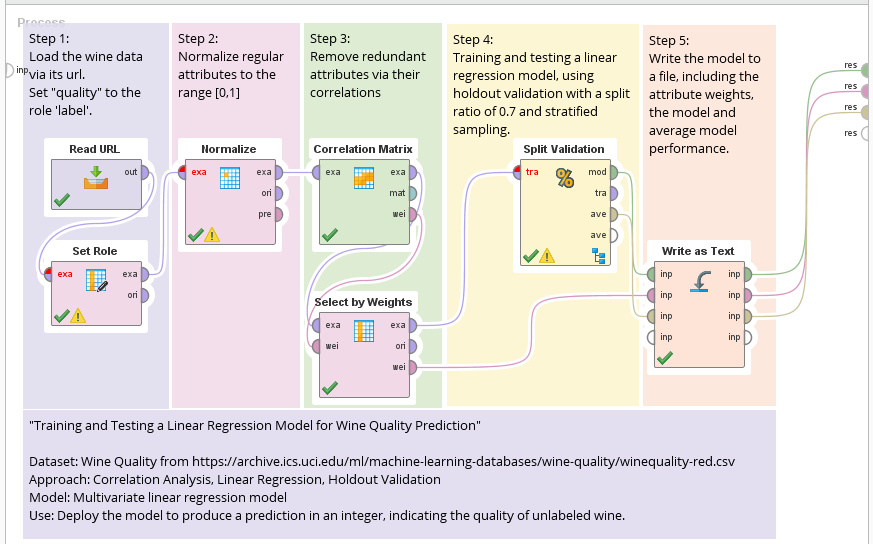
After loading the dataset, we typically need to invoke Set Roles to specify the attribute to be predicted. The following shows the RapidMiner process.
Ports
Here is a list of common port names in RapidMiner.
- exa: example set
- ori: original dataset
- pre: preprocessing model
- mat: matrix
- wei: weight
- tra: training set
- tes: test set
- unl: unlabeled data
- lab: labeled data
- mod: model
- per: (model) performance
- ave: averaged result
- inp: input
Remove Redundant Attributes
The part in Step 3 calculates pair correlations, produces a weight vector based on these correlations and selects top-5 attributes based on the weight vector.
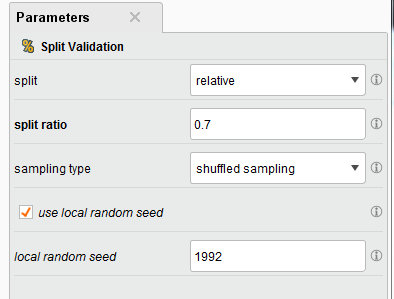
The Operator Split Validation
In the part of Step 4, the Split Validation box is configured to shuffle data into two subsets, sized 70% and 30% of data. Check the option use local random seed if the same sampling result is required in multiple runs.
The Split Validation is a compound process with two inner processes inside. Double-click the operator to display the inner processes. Two subprocesses, training and testing, are built in the following way:
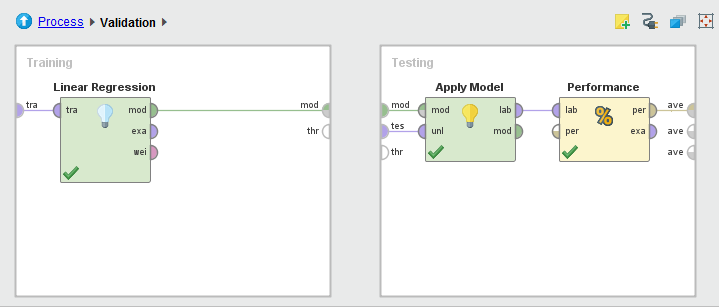
Training Phase
In the Training phase, the Linear Regression operator builds a linear regression model upon the training set entering from the port tra. The model is then fed into the Testing phase for performance evaluation. The following shows parameter setting.
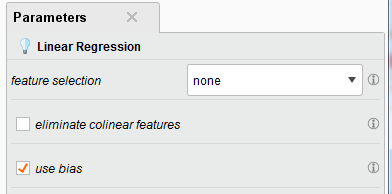
use bias (optional): This parameter indicates if an intercept value should be calculated or not.
Testing Phase
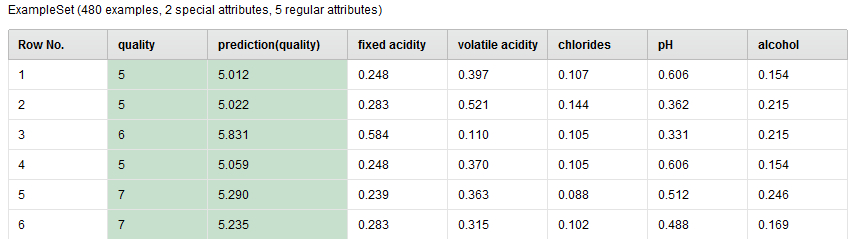
In the Testing phase, the Apply Model operator runs the model upon the test set (unlabeled examples) and predict the label value (wine quality) for each example in the test set. The prediction is added to the test set in a new column named prediction(quality). The following is a sample view of the set which is generated from the port lab of Apply Model.
Performance Evaluation
After applying the model and producing the prediction column in the test set, the performance of the model will be evaluated in the Performance(Regression) operator.
In the Parameters of Performance(Regression), check the criteria, such as root mean square error, relative error and squared correlation. These measures will show how close the prediction is from the truth. The following is a sample of performance measures.
root_mean_squared_error: 0.683 +/- 0.000
relative_error: 9.74% +/- 9.00%
squared_correlation: 0.370
The Linear Model
$$
\begin{eqnarray}
\text{prediction of quality} &=& 0.208 * \text{fixed acidity} \\\
&-& 1.822 * \text{volatile acidity} \\\
&-& 0.391 * chlorides \\\
&-& 0.422 * pH \\\
&+& 2.105 * alcohol \\\
&+& 5.661
\end{eqnarray}
$$
Write the model to a file
After finding a model whose performance is acceptable, the model and its performance can be exported into a text file via the Write as Text operator. A sample output is shown below.
20.01.2018 17:01:04 Results of ResultWriter 'Write as Text' [1]:
20.01.2018 17:01:04   0.208 * fixed acidity
- 1.822 * volatile acidity
- 0.391 * chlorides
- 0.422 * pH
+ 2.105 * alcohol
+ 5.661
20.01.2018 17:01:04 AttributeWeights:
fixed acidity: 0.208
volatile acidity: 0.709
citric acid: 0.125
residual sugar: 0.000
chlorides: 0.175
free sulfur dioxide: 0.133
total sulfur dioxide: 0.098
density: 0.019
pH: 1.000
sulphates: 0.101
alcohol: 0.679

20.01.2018 17:01:04 PerformanceVector:
root_mean_squared_error: 0.683 +/- 0.000
relative_error: 9.74% +/- 9.00%
squared_correlation: 0.370
Share this post
Twitter
Facebook
LinkedIn
Email